Using Grafana
Grafana has a marvelous datasource type called Infinity. It is highly flexible in it's own right, and the numerous options it provides to configure additional funcitonality makes it a great choice for interacting with APIs for various purposes. In this case, I am using it to access the OpenZiti management API to retrieve reference information for transforming the zitiIds (Identity, Edge Router, etc.) to their human readable names.
Prerequisites
- A Grafana instance
- The Infinity datasource for Grafana installed
- Sufficient access to the Grafana instance to allow the provisioning of datasources and creation of dashboards
- An OpenZiti admin user identity
Configure the datasource
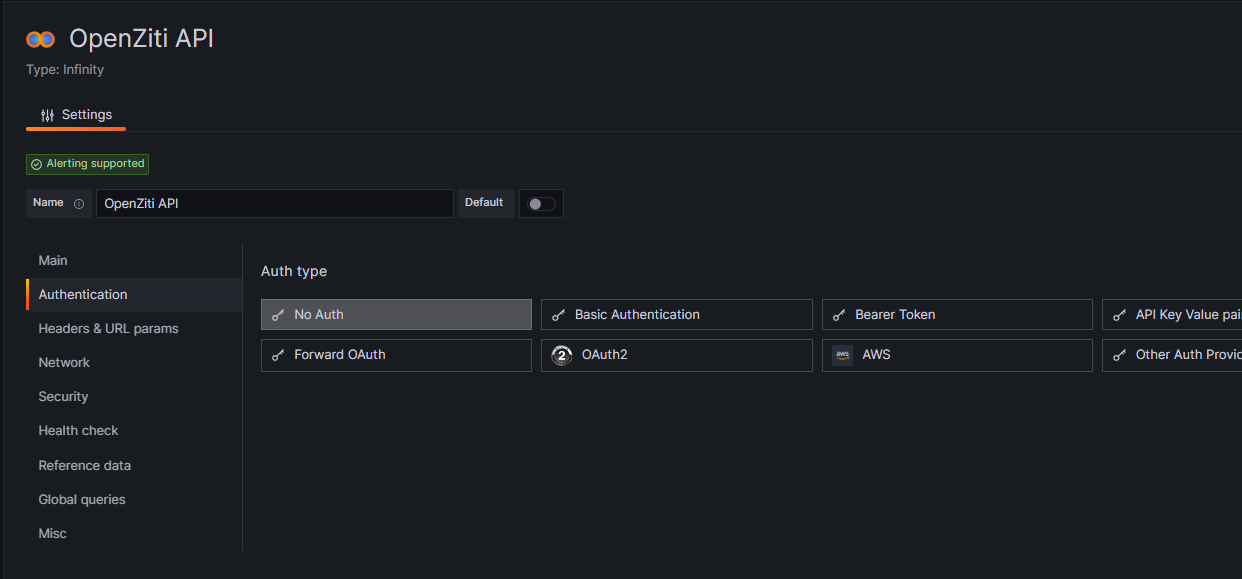
The configuration of the datasource is simple, but a little nonintuitive.
We set the name of the server, in this case our network Controller, but no authentication. This seems odd for a secure network, but the datasource does not provide (at this level) the tools we need to interact with the authentication endpoint to receive an API Session token.
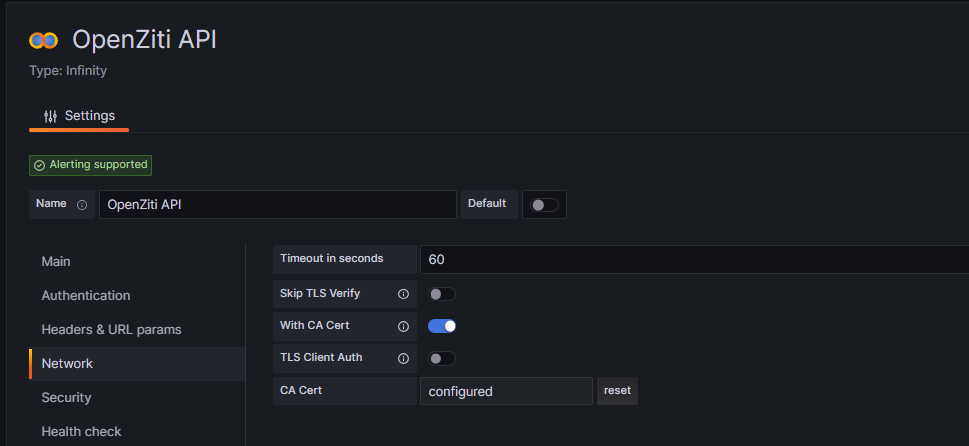
In the network section, we can provide the CA certificate for the controller, or skip TLS verification, depending on your security posture needs. To obtain the CA cert, use an identity.json file from the network instance and the command ziti ops unwrap <IDENTITY.JSON> This will break out the certificate, CA, and key file from the identity individually, then just copy and paste the CA into the entry field provided when selecting "With CA Cert".
Create a dashboard
-
Create a new dashbaord, select the Settings gear in the upper right, and go to the Variables option.
-
Add a variable
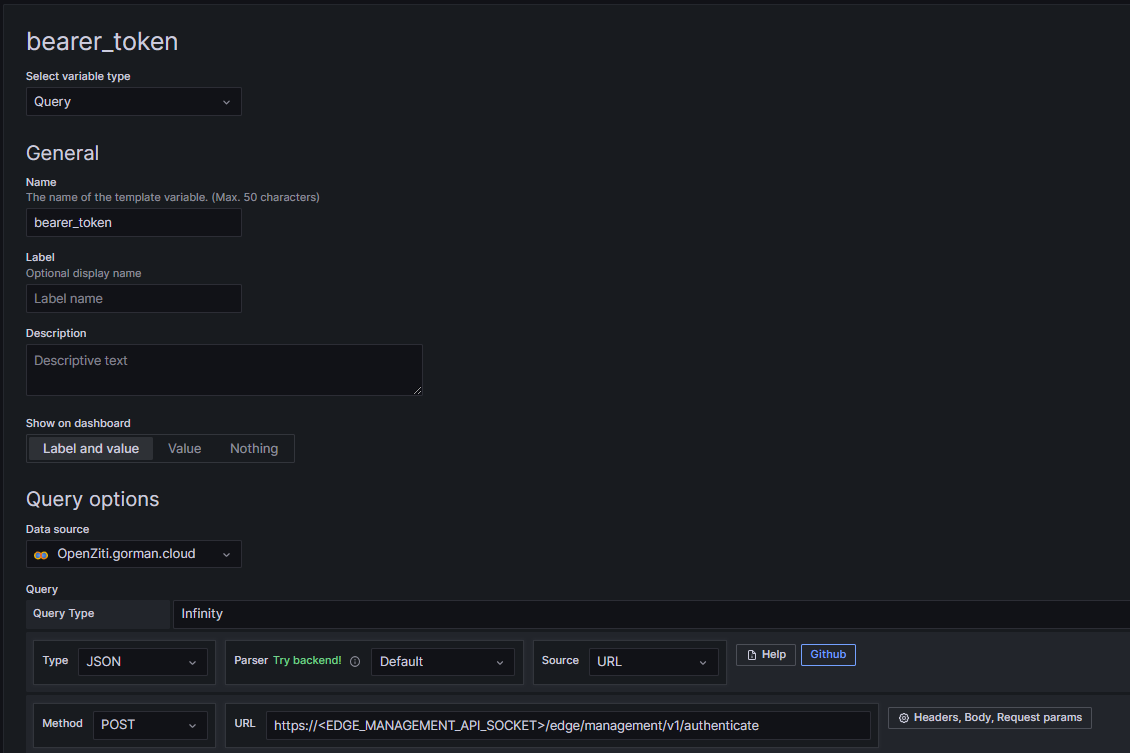
We are going to use the authenticate endpoint and our credentials to retrieve the bearer token for use in the headers of the requests for actual data. Note that thses are part of the configuration, and therefore you must be careful about editor and admin access to the Grafana instance and node to protect these credentials.
-
Build the query as below, entering your edge management API socket address
-
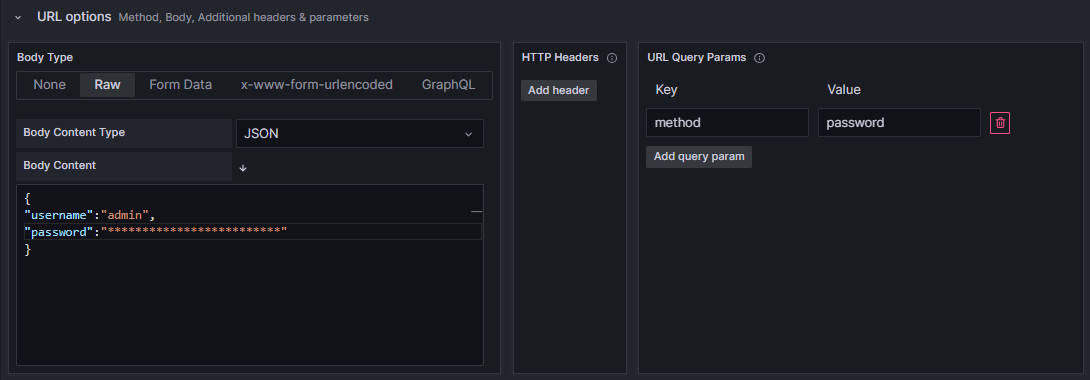
Open the URL options by selecting the Headers, Body, Request params button to the right of the URL and configure as below, entering the username and password from your identity.
-
In the Parsing options and Result fields, enter the below. The Infinity datasource provides JSONPath functionality, which is used here to extract the API Session token for use in the panel queries.

-
Save Dashboard
Note: Once you have verified the query is working properly, you should hide the variable and label on the dashbaord, as it is a "live" token for the identity used to access the API. Again, be very mindful of the access users have to the Grafana instance and node for security reasons.
-
Add a new visualization to the dashboard, and configure the query as below.
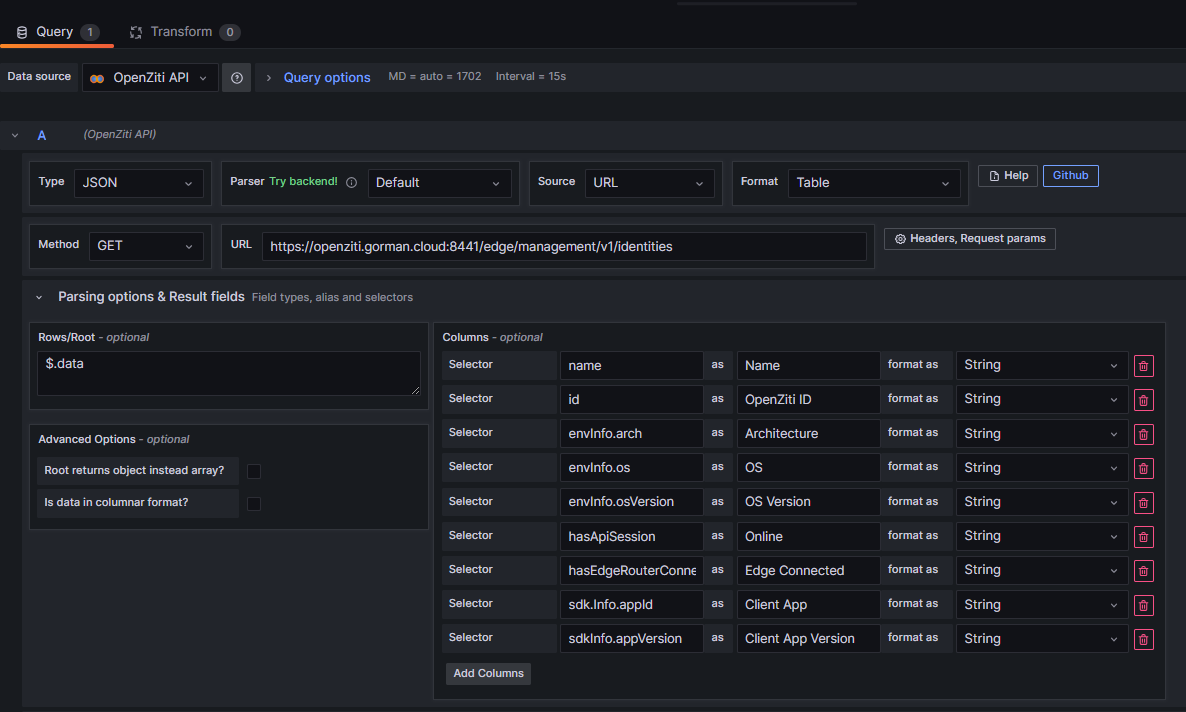
-
Select the Headers, Request params button next to the URL field
-
Enter the zt-session header as below.

- Save and refresh and voila! You have read the management API and displayed the identity status information from your OpenZiti network.
